|
|
 发表于 9-7-2008 10:13 AM
|
显示全部楼层
发表于 9-7-2008 10:13 AM
|
显示全部楼层
当心家私业。
已经有一间供应商被这行拖欠过百千的烂账。
而且,对欧美订单这些公司通常是签下为期至少一年的合同,原材料大起时候就。。。。 |
|
|
|
|
|
|
|
|
|
|
|
发表于 9-7-2008 10:23 AM
|
显示全部楼层
|
|
|
|
|
|
|
|
|
|
|
发表于 30-7-2008 08:06 PM
|
显示全部楼层
Price - RM1.05
EPS - 16.86 Sen
P/E - 6.23 
D/Y - 7.62%
NTA - RM1.60
ROE - 11.01%
Cash per share - 64.58 Sen
Debt/Equity - 0.16
Current Ratio - 5.50
Price/Book - 0.66
我还是一只菜鸟,所以对这些数据不太了解可以解释给我看吗?
EPS??P/E??D/Y??NTA??ROE?? |
|
|
|
|
|
|
|
|
|
|
|
发表于 30-7-2008 10:21 PM
|
显示全部楼层
Largest 30 Shareholders
# SHAREHOLDER SHARES HELD %
1 TBHL HOLDINGS SB 12,141,594 30.20
2 TBHL HOLDINGS SB 6,369,606 15.84
3 GUAN KOK BENG 1,451,624 3.61
4 AKAUN JAMINAN PINJAMAN KERAJAAN PERSEKUTUAN 1,315,700 3.27
5 GUAN KIM HENG 1,084,036 2.70
6 GUAN KIM LOONG 742,576 1.85
7 LEMBAGA TABUNG ANGKATAN TENTERA 688,000 1.71
8 ALLIANCEGROUP NOM SB PHEIM ASSET MGMT SB - EPF 673,600 1.68
9 TING HON SUM 660,764 1.64
10 STABLE LEVEL SB 498,000 1.24
11 GUAN KOK BENG 454,500 1.13
12 OOI PEY WONG 401,800 1.00
13 YEOH KEAN HUA 380,000 0.95
14 AMMB NOM SB AMTRUSTEE BHD - APEX DANA AL-SOFI-L 349,500 0.87
15 ALLIANCEGROUP NOM SB PHEIM ASSET MGMT SB-MAGNUM CORP.BHD 300,000 0.75
16 AIBB NOM SB PLED SEC ACC - KOEK TIANG KUNG 275,800 0.69
17 MAYBAN NOM SB PHEIM ASSET MGMT SB - BENTA WAWASAN SB 252,300 0.63
18 YANG PING 234,000 0.58
19 ALLIANCEGROUP NOM SB PLED SEC ACC - NG AH CHAI 224,800 0.56
20 MSIA NOM SB PHEIM ASSET MGMG SB - PINTARAS JAYA BHD 221,000 0.55
21 CITIGROUP NOM SB PLED SEC ACC - NG AH CHAI 199,300 0.50
22 CHENG MEI FUNG @ CHIRM MEI FUNG 185,200 0.46
23 CHAN BENG TEIK 179,000 0.45
24 LIM YOKE LIN 161,000 0.40
25 TEE KIAN HONG 160,000 0.40
26 MAYBAN TRUSTEES BHD-PHEIM ASIA EX-JAPAN ISLAMIC FUND 158,200 0.39
27 HLB NOM SB PLED SEC ACC - TEO AH LEK 145,000 0.36
28 AXA AFFIN LIFE INS. BHD-ASIA PACIFIC GROWTH FUND 131,000 0.33
29 ONG JU SENG 129,000 0.32
30 TEOH CHEE 103,000 0.26 |
|
|
|
|
|
|
|
|
|
|
|
发表于 31-7-2008 02:49 AM
|
显示全部楼层
| Company Name | : | EUROSPAN HOLDINGS BERHAD | | Stock Name | : | EUROSP | | Date Announced | : | 28/07/2008 |
| Financial Year End | : | 31/05/2008 | | Quarter | : | 4 | | Quarterly report for the financial period ended | : | 31/05/2008 | | The figures | : | have not been audited |
| Please attach the full Quarterly Report here: |
 20080531.pdf 20080531.pdf
SUMMARY OF KEY FINANCIAL INFORMATION | 31/05/2008 |
| INDIVIDUAL PERIOD | CUMULATIVE PERIOD | | CURRENT YEAR QUARTER | PRECEDING YEAR
CORRESPONDING
QUARTER | CURRENT YEAR TO DATE | PRECEDING YEAR
CORRESPONDING
PERIOD | | 31/05/2008 | 31/05/2007 | 31/05/2008 | 31/05/2007 | | RM'000 | RM'000 | RM'000 | RM'000 | | 1 | Revenue | 17,784 | 20,692 | 73,781 | 71,434 | | 2 | Profit/(loss) before tax | 1,288 | 1,836 | 6,936 | 7,596 | | 3 | Profit/(loss) for the period | 1,140 | 1,798 | 6,329 | 6,777 | | 4 | Profit/(loss) attributable to ordinary equity holders of the parent | 1,140 | 1,798 | 6,329 | 6,777 | | 5 | Basic earnings/(loss) per share (sen) | 2.84 | 4.50 | 15.75 | 16.94 | | 6 | Proposed/Declared dividend per share (sen) | 0.00 | 8.00 | 3.00 | 8.00 |
|
|
|
|
|
|
|
| AS AT END OF CURRENT QUARTER | AS AT PRECEDING FINANCIAL YEAR END | 7
| Net assets per share attributable to ordinary equity holders of the parent (RM) | 1.6701 | 1.6034 |
|
|
|
|
|
|
|
|
|
|
|
|
发表于 31-7-2008 03:22 AM
|
显示全部楼层
原帖由 弹煮 于 6-11-2007 07:53 PM 发表 
假账  
不可能
从B/S 和C/F statement看的到现金
不可能有假账
每股银行现金从六毛多减少到五毛多, 二千六百万减少到二千一百多万
因为它多买进上市公司RM五百五十万的股票 (该不会傻到买家私股吧! ) )
被低估因为是家私股, 十多家私股股价都死死的!
大家都认为在大马是夕阳工业, 同样被低沽的有TAFI
TAFI也是现金多,而且高股息呢!
要买家私股, 不如买Poh Huat
Poh Huat 大马厂十几英亩, 二十年前买很便宜
越南厂九十英亩几年前买的也很便宜, 几年就翻倍
中国厂两百多英亩, 投资九千多万
Poh Huat近来赚大钱, 应该是越南厂开始赚了
但我估计, 接下来可能像前几年那样每季时亏时赚
我估计,中国厂刚开始会和越南厂一样亏钱
无论如何, 它只要卖地NTA就可以翻倍了!
Poh Huat三十年前是TAFI的二手承包商
如今却是倍于TAFI和有恩于Poh Huat的大马第一家上市家私股SHH
主要是老板, 郑景发敢冲敢借!
EUROSPAN 和 TAFI 都是不跟银行借钱的公司.
我猜Poh Huat的营业额今年可超越Kenmark 和Latitude, 成为老大
说到家私股不能不提Datuk Patrik Soh - DPS ~~~~ (Soh刚买了FEDERAL FURNITURE)
年年赚钱,令人怀疑
状态不错的有 TAFI, EUROSPAN, EURO, KENMARK, LATITUDE
还有半死不活的UPS CAP, SHH,Baswell , Sernkou, Lii Hen, SYF
连连亏钱,合情合理
当然还有和Kenmark同为台资的Kimble-徊光反照
[ 本帖最后由 hdcyng 于 31-7-2008 10:35 PM 编辑 ] |
|
|
|
|
|
|
|
|
|
|
|
发表于 31-7-2008 10:30 PM
|
显示全部楼层
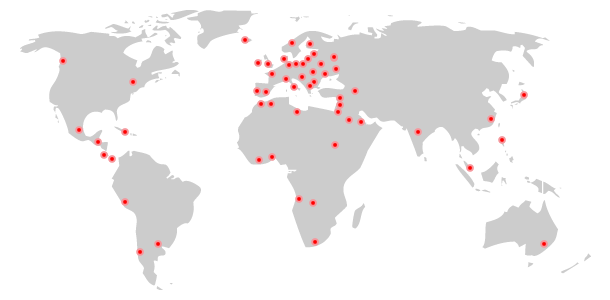
Eurosp products are exported to overseas markets and mainly to Europe, Russia, Japan, Korea, China, Hong Kong, Taiwan, Singapore, Australia, New Zealand, the Middle East, Africa and the Americas.
We have established an international business network through our participation in various international furniture exhibitions throughout the years. We continuously seek long term partnerships with international buyers to seek out market niches in selected high growth countries and to further enhance our delivery capabilities at all stages of the supply chain.
[ 本帖最后由 hdcyng 于 31-7-2008 10:33 PM 编辑 ] |
|
|
|
|
|
|
|
|
|
|
|
发表于 25-10-2010 06:29 PM
|
显示全部楼层
Monday, 25 Oct 2010
5:51PM Special Interim Single Tier Dividend 40 Sen
5:50PM 1Q net loss 0.057 million |
|
|
|
|
|
|
|
|
|
|
|
发表于 25-11-2010 04:10 PM
|
显示全部楼层
|
EUROSP今天很差,今天下了0.04,只有RM1.29了。。。。 |
|
|
|
|
|
|
|
|
|
|
|
 发表于 24-4-2012 03:11 AM
|
显示全部楼层
发表于 24-4-2012 03:11 AM
|
显示全部楼层
SUMMARY OF KEY FINANCIAL INFORMATION | 29/02/2012 |
| INDIVIDUAL PERIOD | CUMULATIVE PERIOD | | CURRENT YEAR QUARTER | PRECEDING YEAR
CORRESPONDING
QUARTER | CURRENT YEAR TO DATE | PRECEDING YEAR
CORRESPONDING
PERIOD | | 29/02/2012 | 28/02/2011 | 29/02/2012 | 28/02/2011 | | $$'000 | $$'000 | $$'000 | $$'000 | | 1 | Revenue | 15,742 | 12,542 | 48,009 | 48,716 | | 2 | Profit/(loss) before tax | 1,141 | -1,541 | -134 | -2,882 | | 3 | Profit/(loss) for the period | 1,570 | -1,429 | 724 | -2,481 | | 4 | Profit/(loss) attributable to ordinary equity holders of the parent | 1,570 | -1,429 | 724 | -2,481 | | 5 | Basic earnings/(loss) per share (Subunit) | 3.53 | -3.35 | 1.63 | -5.81 | | 6 | Proposed/Declared dividend per share (Subunit) | 0.00 | 0.00 | 0.00 | 40.00 |
|
|
|
|
|
|
|
| AS AT END OF CURRENT QUARTER | AS AT PRECEDING FINANCIAL YEAR END | 7
| Net assets per share attributable to ordinary equity holders of the parent ($$) | 0.9753 | 0.9590 |
|
|
|
|
|
|
|
|
|
|
|
|
发表于 25-4-2012 12:20 AM
|
显示全部楼层
本帖最后由 icy97 于 25-4-2012 12:57 AM 编辑
欧展控股转亏为盈
财经新闻 财经 2012-04-24 12:00
(吉隆坡23日讯)欧展控股(Eurosp,7094,主板消费产品股)在截至2012年2月杪的财年第三季成功转亏为盈,共录得157万令吉的净利,上财年同期则蒙亏142万9000令吉。
单季营业额表现亮眼,按年增长25.5%至1574万2000令吉,上财年同期营业额为1254万2000令吉。
文告指出,营运成本走低和产品结构多元化是促使公司第三季业绩表现转好的主因。
至于首三季业绩表现,欧展控股的净利合计72万4000令吉,上财年则面对248万1000令吉的净亏损;营业额报4800万9000令吉,上财年同期为4871万6000令吉,下挫1.5%。
每股盈利方面,单季每股盈利处于3.53仙的水平,合计三季的每股盈利为1.63仙。
欧展控股董事部指出,如无任何意外,公司在截至2012年5月杪的财年,将取得令人满意的业绩表现。[Nanyang] |
|
|
|
|
|
|
|
|
|
|
|
发表于 30-7-2012 08:57 PM
|
显示全部楼层
SUMMARY OF KEY FINANCIAL INFORMATION
31/05/2012 |
| | INDIVIDUAL PERIOD | CUMULATIVE PERIOD | CURRENT YEAR QUARTER | PRECEDING YEAR
CORRESPONDING
QUARTER | CURRENT YEAR TO DATE | PRECEDING YEAR
CORRESPONDING
PERIOD | 31/05/2012 | 31/05/2011 | 31/05/2012 | 31/05/2011 | $$'000 | $$'000 | $$'000 | $$'000 |
| 1 | Revenue | 15,949 | 13,820 | 63,958 | 62,536 | | 2 | Profit/(loss) before tax | -4,503 | -2,474 | -4,637 | -5,356 | | 3 | Profit/(loss) for the period | -4,506 | -2,163 | -3,782 | -4,644 | | 4 | Profit/(loss) attributable to ordinary equity holders of the parent | -4,506 | -2,163 | -3,782 | -4,644 | | 5 | Basic earnings/(loss) per share (Subunit) | -10.14 | 5.07 | -8.51 | -10.88 | | 6 | Proposed/Declared dividend per share (Subunit) | 0.00 | 0.00 | 0.00 | 40.00 |
|
| AS AT END OF CURRENT QUARTER | AS AT PRECEDING FINANCIAL YEAR END | 7
| Net assets per share attributable to ordinary equity holders of the parent ($$) | 0.8742 | 0.9590 |
|
|
|
|
|
|
|
|
|
|
|
|
发表于 30-10-2012 12:41 AM
|
显示全部楼层
SUMMARY OF KEY FINANCIAL INFORMATION
31/08/2012 |
| | INDIVIDUAL PERIOD | CUMULATIVE PERIOD | CURRENT YEAR QUARTER | PRECEDING YEAR
CORRESPONDING
QUARTER | CURRENT YEAR TO DATE | PRECEDING YEAR
CORRESPONDING
PERIOD | 31/08/2012 | 31/08/2011 | 31/08/2012 | 31/08/2011 | $$'000 | $$'000 | $$'000 | $$'000 |
| 1 | Revenue | 17,818 | 16,790 | 17,818 | 16,790 | | 2 | Profit/(loss) before tax | 1,534 | -1,161 | 1,534 | -1,161 | | 3 | Profit/(loss) for the period | 1,256 | -700 | 1,256 | -700 | | 4 | Profit/(loss) attributable to ordinary equity holders of the parent | 1,256 | -700 | 1,256 | -700 | | 5 | Basic earnings/(loss) per share (Subunit) | 2.83 | -1.58 | 2.83 | -1.58 | | 6 | Proposed/Declared dividend per share (Subunit) | 0.00 | 0.00 | 0.00 | 0.00 |
|
| AS AT END OF CURRENT QUARTER | AS AT PRECEDING FINANCIAL YEAR END | 7
| Net assets per share attributable to ordinary equity holders of the parent ($$) | 0.9025 | 0.8742 |
|
|
|
|
|
|
|
|
|
|
|
|
发表于 31-1-2013 01:58 AM
|
显示全部楼层
SUMMARY OF KEY FINANCIAL INFORMATION
30/11/2012 |
| | INDIVIDUAL PERIOD | CUMULATIVE PERIOD | CURRENT YEAR QUARTER | PRECEDING YEAR
CORRESPONDING
QUARTER | CURRENT YEAR TO DATE | PRECEDING YEAR
CORRESPONDING
PERIOD | 30/11/2012 | 30/11/2011 | 30/11/2012 | 30/11/2011 | $$'000 | $$'000 | $$'000 | $$'000 |
| 1 | Revenue | 15,513 | 15,477 | 33,330 | 32,267 | | 2 | Profit/(loss) before tax | 694 | -114 | 2,228 | -1,275 | | 3 | Profit/(loss) for the period | 603 | 286 | 1,859 | -413 | | 4 | Profit/(loss) attributable to ordinary equity holders of the parent | 603 | 286 | 1,859 | -413 | | 5 | Basic earnings/(loss) per share (Subunit) | 1.36 | 0.64 | 4.18 | -0.93 | | 6 | Proposed/Declared dividend per share (Subunit) | 0.00 | 0.00 | 0.00 | 0.00 |
|
| AS AT END OF CURRENT QUARTER | AS AT PRECEDING FINANCIAL YEAR END | 7
| Net assets per share attributable to ordinary equity holders of the parent ($$) | 0.9160 | 0.8742 |
|
|
|
|
|
|
|
|
|
|
|
|
发表于 31-1-2013 02:00 AM
|
显示全部楼层
Type | Announcement | Subject | PROVISION OF FINANCIAL ASSISTANCE | Description | 1. Introduction
Pursuant to paragraph 8.23(1)(ii) of the Listing Requirements of Bursa Malaysia Securities Berhad, the Board of Directors of Eurospan Holdings Berhad ("EUROSP" or "the Company") wishes to announce that its wholly-owned subsidiary, Eurospan Furniture Sdn Bhd ("EUR") has rendered financial assistance to suppliers of materials as at the second quarter ended 30 November 2012.
2. Details of the provision of financial assistance
Please refer to the table 1 below
The advances given by EUR to the suppliers of raw materials are at no fixed terms of repayment.
3. Rationale for the provision of financial assistance
The Provision of Financial Assistance is to secure the supply of raw materials and is necessary to facilitate the ordinary course of business of EUR.
4. Financial Effects
4.1 Share capital
The provision of financial assistance has no effect on the share capital and shareholdings structure of EUROSP for the quarter ended 30 November 2012.
4.2 Earnings
There is no material impact on the earnings of EUROSP for the quarter ended 30 November 2012.
4.3 Net Assets ("NA")
There is no material impact on the NA of EUROSP for the quarter ended 30 November 2012.
5. Directors and substantial shareholders' interest
None of the Directors of EUROSP, substantial shareholders and persons connected with the Directors and substantial shareholders of EUROSP has any interest, whether direct or indirect, in the provision of financial assistance.
This announcement is dated 30th January, 2013 | Table 1
Type of Financial Assistance | | | Repaid during the quarter ended 30 November 2012 | | | | | | | Interest Free Cash Advance | | Suppliers of raw materials | | | |
|
|
|
|
|
|
|
|
|
|
|
|
|
发表于 1-5-2013 01:40 AM
|
显示全部楼层
SUMMARY OF KEY FINANCIAL INFORMATION
28/02/2013 |
| | INDIVIDUAL PERIOD | CUMULATIVE PERIOD | CURRENT YEAR QUARTER | PRECEDING YEAR
CORRESPONDING
QUARTER | CURRENT YEAR TO DATE | PRECEDING YEAR
CORRESPONDING
PERIOD | 28/02/2013 | 29/02/2012 | 28/02/2013 | 29/02/2012 | $$'000 | $$'000 | $$'000 | $$'000 |
| 1 | Revenue | 12,685 | 15,742 | 46,015 | 48,009 | | 2 | Profit/(loss) before tax | 276 | 1,141 | 2,504 | -134 | | 3 | Profit/(loss) for the period | 275 | 1,571 | 2,134 | 724 | | 4 | Profit/(loss) attributable to ordinary equity holders of the parent | 275 | 1,571 | 2,134 | 724 | | 5 | Basic earnings/(loss) per share (Subunit) | 0.62 | 3.54 | 4.80 | 1.63 | | 6 | Proposed/Declared dividend per share (Subunit) | 0.00 | 0.00 | 0.00 | 0.00 |
|
| AS AT END OF CURRENT QUARTER | AS AT PRECEDING FINANCIAL YEAR END | 7
| Net assets per share attributable to ordinary equity holders of the parent ($$) | 0.9222 | 0.8742 |
|
|
|
|
|
|
|
|
|
|
|
|
发表于 1-5-2013 01:41 AM
|
显示全部楼层
Type | Announcement | Subject | PROVISION OF FINANCIAL ASSISTANCE | Description | 1. Introduction
Pursuant to paragraph 8.23(1)(ii) of the Listing Requirements of Bursa Malaysia Securities Berhad, the Board of Directors of Eurospan Holdings Berhad ("EUROSP" or "the Company") wishes to announce that its wholly-owned subsidiary, Eurospan Furniture Sdn Bhd ("EUR") has rendered financial assistance to suppliers of materials as at the third quarter ended 28 February 2013.
2. Details of the provision of financial assistance
Please refer to table 1 below.
The advances given by EUR to the suppliers of raw materials are at no fixed terms of repayment.
3. Rationale for the provision of financial assistance
The Provision of Financial Assistance is to secure the supply of raw materials and is necessary to facilitate the ordinary course of business of EUR.
4. Financial Effects
4.1 Share capital
The provision of financial assistance has no effect on the share capital and shareholdings structure of EUROSP for the quarter ended 28 February 2013.
4.2 Earnings
There is no material impact on the earnings of EUROSP for the quarter ended 28 February 2013.
4.3 Net Assets ("NA")
There is no material impact on the NA of EUROSP for the quarter ended 28 February 2013.
5. Directors and substantial shareholders' interest
None of the Directors of EUROSP, substantial shareholders and person connected with the Directors and substantial shareholders of EUROSP has any interest, whether direct or indirect, in the provision of financial assistance.
This announcement is dated 29th April, 2013. | Table 1
Type of Financial Assistance | | | During the quarter ended 28 February 2013 | | | |
|
|
| Interest Free Cash Advance | | Suppliers of raw materials | | | |
|
|
|
|
|
|
|
|
|
|
|
|
|
|
发表于 29-7-2013 11:36 PM
|
显示全部楼层
SUMMARY OF KEY FINANCIAL INFORMATION
31/05/2013 |
| | INDIVIDUAL PERIOD | CUMULATIVE PERIOD | CURRENT YEAR QUARTER | PRECEDING YEAR
CORRESPONDING
QUARTER | CURRENT YEAR TO DATE | PRECEDING YEAR
CORRESPONDING
PERIOD | 31/05/2013 | 31/05/2012 | 31/05/2013 | 31/05/2012 | $$'000 | $$'000 | $$'000 | $$'000 |
| 1 | Revenue | 14,887 | 15,949 | 60,902 | 63,958 | | 2 | Profit/(loss) before tax | 1,170 | -4,503 | 3,674 | -4,637 | | 3 | Profit/(loss) for the period | 843 | -4,506 | 2,977 | -3,782 | | 4 | Profit/(loss) attributable to ordinary equity holders of the parent | 843 | -4,506 | 2,977 | -3,782 | | 5 | Basic earnings/(loss) per share (Subunit) | 1.90 | -10.14 | 6.70 | -8.51 | | 6 | Proposed/Declared dividend per share (Subunit) | 0.00 | 0.00 | 0.00 | 0.00 |
|
| AS AT END OF CURRENT QUARTER | AS AT PRECEDING FINANCIAL YEAR END | 7
| Net assets per share attributable to ordinary equity holders of the parent ($$) | 0.9413 | 0.8742 |
|
|
|
|
|
|
|
|
|
|
|
|
发表于 29-10-2013 03:16 AM
|
显示全部楼层
SUMMARY OF KEY FINANCIAL INFORMATION
31/08/2013 |
| | INDIVIDUAL PERIOD | CUMULATIVE PERIOD | CURRENT YEAR QUARTER | PRECEDING YEAR
CORRESPONDING
QUARTER | CURRENT YEAR TO DATE | PRECEDING YEAR
CORRESPONDING
PERIOD | 31/08/2013 | 31/08/2012 | 31/08/2013 | 31/08/2012 | $$'000 | $$'000 | $$'000 | $$'000 |
| 1 | Revenue | 17,118 | 17,818 | 17,118 | 17,818 | | 2 | Profit/(loss) before tax | 1,444 | 1,534 | 1,444 | 1,534 | | 3 | Profit/(loss) for the period | 1,560 | 1,256 | 1,560 | 1,256 | | 4 | Profit/(loss) attributable to ordinary equity holders of the parent | 1,560 | 1,256 | 1,560 | 1,256 | | 5 | Basic earnings/(loss) per share (Subunit) | 3.51 | 2.83 | 3.51 | 2.83 | | 6 | Proposed/Declared dividend per share (Subunit) | 0.00 | 0.00 | 0.00 | 0.00 |
|
| AS AT END OF CURRENT QUARTER | AS AT PRECEDING FINANCIAL YEAR END | 7
| Net assets per share attributable to ordinary equity holders of the parent ($$) | 0.9823 | 0.9472 |
|
|
|
|
|
|
|
|
|
|
|
|
发表于 14-1-2014 03:13 AM
|
显示全部楼层
SUMMARY OF KEY FINANCIAL INFORMATION
30/11/2013 |
| | INDIVIDUAL PERIOD | CUMULATIVE PERIOD | CURRENT YEAR QUARTER | PRECEDING YEAR
CORRESPONDING
QUARTER | CURRENT YEAR TO DATE | PRECEDING YEAR
CORRESPONDING
PERIOD | 30/11/2013 | 30/11/2012 | 30/11/2013 | 30/11/2012 | $$'000 | $$'000 | $$'000 | $$'000 |
| 1 | Revenue | 17,464 | 15,513 | 34,582 | 33,330 | | 2 | Profit/(loss) before tax | 1,968 | 694 | 3,412 | 2,228 | | 3 | Profit/(loss) for the period | 1,563 | 603 | 3,123 | 1,859 | | 4 | Profit/(loss) attributable to ordinary equity holders of the parent | 1,563 | 603 | 3,123 | 1,859 | | 5 | Basic earnings/(loss) per share (Subunit) | 3.52 | 1.36 | 7.03 | 4.18 | | 6 | Proposed/Declared dividend per share (Subunit) | 0.00 | 0.00 | 0.00 | 0.00 |
|
| AS AT END OF CURRENT QUARTER | AS AT PRECEDING FINANCIAL YEAR END | 7
| Net assets per share attributable to ordinary equity holders of the parent ($$) | 1.0175 | 0.9472 |
|
|
|
|
|
|
|
|
|
|
| |
 本周最热论坛帖子 本周最热论坛帖子
|


 2723
2723  84
84